

Data Notes – Data is from the Oregon Department of Fish and Wildlife (ODFW) hunter harvest surveys. Prior to 2012 the data is less reliable because the survey was done by telephone and was not mandatory. Nevertheless, all years were included to give you access to the complete dataset.
Hunt names entered by ODFW are stored in an inconsistent manner. For example, in different years the same hunt suffix may be written as #1, Number 1, No. 1, or 1. Computers are unable to tell those represent the same hunt, so the data irregularities must be manually grouped together. If you notice an error in our hunt name groupings, then please email your finding to vizwildmail @ gmail.com.
Dashboard Instructions
The dashboard is interactive. Data visualized on the map and bar chart will update as you make different selections.
You can click the bar chart, or the map to filter to a specific unit. If you use CTRL+click you can select multiple hunting units at the same time. To clear the filter, re-click the hunting unit you selected.
Filters – Underneath the dashboard title there are filters:![]()
1) Select Data filter – This filter allows you to choose one measure to be displayed on the dashboard and charts. Available measures include total harvest, total bulls, antlerless, total hunters, days hunted and count of bulls harvested by antler point.
2) Weapon filter – The weapon filter allows you to select one, two or all three weapons. The weapon choices are rifle, bow and muzzleloader.
3) Season Type filter – Season types like General, Controlled, Disabled Permit and Premium can be selected. You can choose one or multiple. Disabled permit data only exists from 2006-2011. Premium hunt data only exists from 2016 onward.
4) Hunting Unit filter – The hunting unit filter allows you to select one, many or all hunting units.
3) Season/Tag/Hunt filter – The season/tag/hunt filter allows you to select one, many or all subhunts.
Date range selector – Above the map there is a date range selector.
The date range selector allows you to control the years in data visualizations. You can also use the scroll bar or you can just click the numbers on the left or right and type in the year.
Subunit Data – On the bar chart you can expand the hunting units to see subunit data.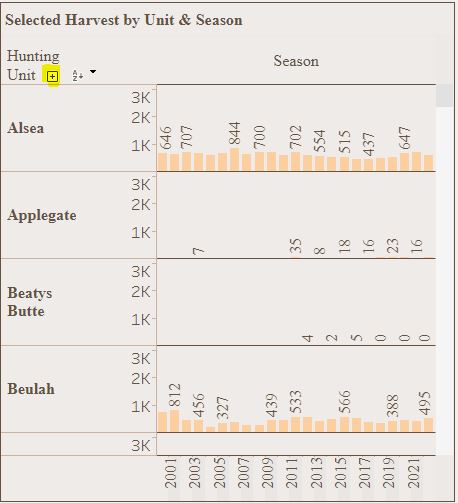
Before subunit expansion. Note highlighted + symbol.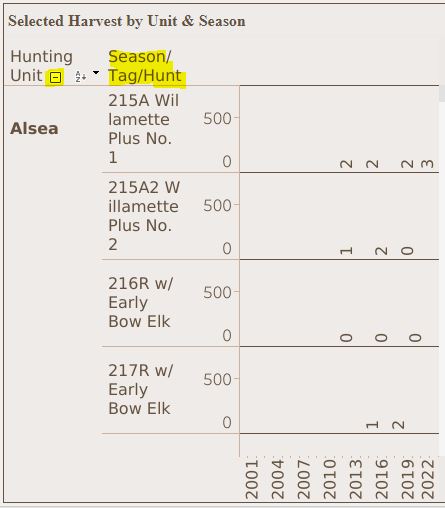
After subunit expansion. Note subunit hunt data has appeared.
To expand subunit data, hover your cursor in the highlighted area with the + (see first bar chart image). The plus symbol appears when you are in the correct area. Click the symbol and the subunits will expand. Once expanded, you can click the – symbol if you want to hide the subunit data.
The bar charts reflect the sum of the data measure, weapon, hunting unit and years you selected.
Total Harvest Sum – Above the bar chart and on the right side of the dashboard is a box with the cumulative sum of all selections.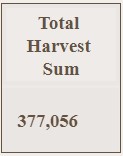
For example, the above image shows the number 377,056. This is the total number of elk harvested in all units in Oregon from 2000-2022. If you narrow the date range to 2019-2020, select the Walla Walla Unit, and choose total bulls as the measure, then the box shows the cumulative sum for 2019-2020 bull elk harvest in the Walla Walla Unit.
State of Oregon Hunting Unit Heatmap – The state of Oregon displays a heatmap with a range of color intensities over each hunting unit. The color intensity reflects each unit’s harvest relative to the other units. The number over the unit reflects the sum of that hunting unit’s data measure. The Select Data filter, and the years you select with the date range selector determines the data applied to the map.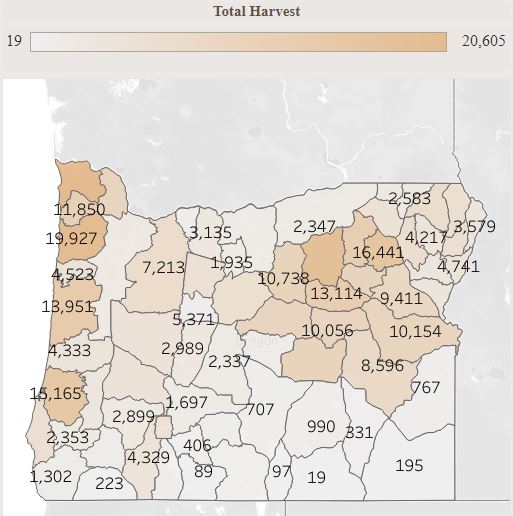
Seeing unexpected results?
If you are seeing unexpected results on the dashboard, then double check each filter. You may have forgotten about a filter that is in place.
Page tags: Oregon Elk Hunting, Oregon Elk Harvest, Oregon Elk Hunting Statistics, Oregon Elk Hunting Harvest, Oregon Elk Data
Photo Credit: Unsplash.com, Meredith Fontana