

Data Notes – Data is from the Oregon Department of Fish and Wildlife (ODFW) hunter harvest surveys. ODFW only had Mountain Goat harvest data after 2015.
Dashboard Instructions
The dashboard is interactive. Data visualized on the charts will update as you make selections.
You can click the data points on the chart or table to filter and highlight the data you clicked. If you use CTRL+click you can select multiple data points at the same time. To clear the filter, re-click the hunting unit you selected.
Filters – Underneath the dashboard title there are filters:![]()
1) B&C Score – This filter allows you to the range of B&C (Boone and Crocket) scoring goats displayed on the dashboard and charts.
2) Hunting Area filter – The hunt area filter allows you to select one, many or all hunting areas.
3) Sex filter – You can select one, multiple or all sexes of harvested goats to display on the charts.
4) Season – Select the range of hunting seasons reflected on the charts. You can use the slider or click the numbers and type in the years.
Age vs Score – On the scatterplot you can see the relationship between mountain goats ages and Boone and Crocket (B&C) scores. Each circle represents one harvested goat. Colors also indicate the sex of the harvested goat, so you can also see the relationship between sex and B&C score.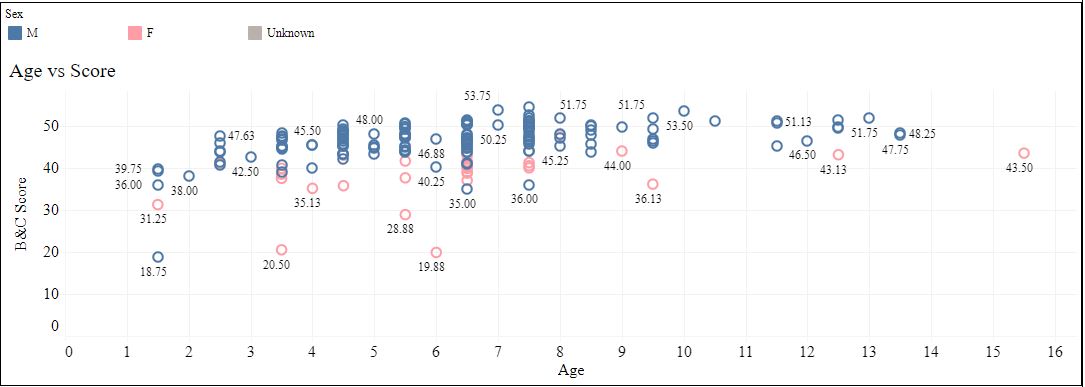
Hunt Area, Score and Year – The chart on the bottom left shows the score of harvested goats by their hunt area and hunting season. Each circle represents one goat. Circles are also colored according to sex of the goat. If you click on a circle the other two charts will filter to that specific goat’s data. If you click on a hunt area name, such as Elkhorn Mtns, then all charts on the dashboard will filter to goats harvested in the Elkhorn Mtns hunt area.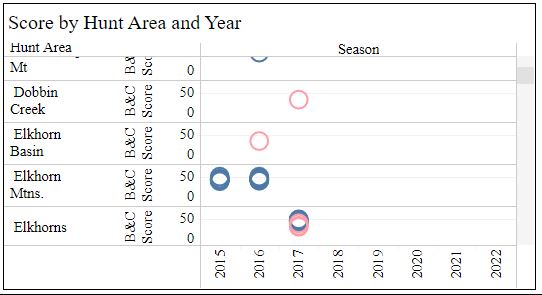
Avg Scores – The table on the bottom right has the average B&C score for each hunt area, the rank of that hunt area’s score out of all Oregon hunt areas, and the number of goats that went into the average. The idea is to show which hunt areas are producing the highest scoring goats. If you click a row on the table, then the other two charts will update.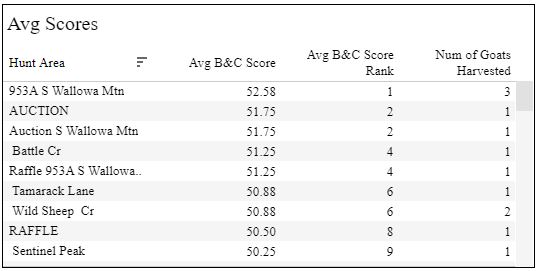
Seeing unexpected results?
If you are seeing unexpected results on the dashboard, then double check each filter. You may have forgotten about a filter that is in place.
Page tags: Oregon Mountain Goat Hunting, Oregon Mountain Goat Harvest, Oregon Mountain Goat Hunting Statistics, Oregon Mountain Goat Hunting Harvest, Oregon Mountain Goat Data
Photo Credit: Unsplash.com – JJ Shev.