
Act now and support VizWild! Scroll to the bottom of the page to find the donate button. Your contribution will help bring data tools and advocacy to the hunting public. VizWild is a 501(c)(3) non-profit.
Introduction
The Oregon Department of Fish and Wildlife (ODFW) is responsible for managing Oregon elk herds. In its role as a public agency, ODFW publishes elk management objective (MO) and population estimate (PE) data on the web.
ODFW’s elk management plan contains MOs at the survey unit level. A survey unit is usually just one hunting unit. However, a few survey units encompass multiple hunting units.
Each elk subspecies has 5 years of population data. Roosevelt elk data spans the years 2015-2019, while Rocky Mountain elk data spans 2017-2021. Ratios for bulls:100 cows and calves:100 cows for each survey unit are included in ODFW’s published data.
On another webpage, ODFW publishes data from mandatory elk hunter harvest surveys. An interactive dashboard with the 2015-2021 elk harvest data was previously published on VizWild.
ODFW population estimates suggest elk populations are below MO in the majority of ODFW’s survey units.
To understand why so many units have elk populations below the objective, the population estimates, management objectives, and hunter-harvest data were combined and analyzed below.
The data visualizations are interactive. You can hover or click charts to get more info, use highlighters to find a unit, or filters to select specific data. The visualizations are in Tableau Public workbooks, which can be downloaded for free by anyone. Please be patient, the visualizations may take a few moments to load.
Note about the data: To facilitate analysis, ODFW’s 5-years of population data was averaged for each survey unit, as was matched 5 year harvest data. When the terms population, harvest, or abbreviation ‘PE,’ are used, they imply the average values. Management objectives do not change year to year, so they did not need to be averaged.
Data
Population vs Management Objective Status
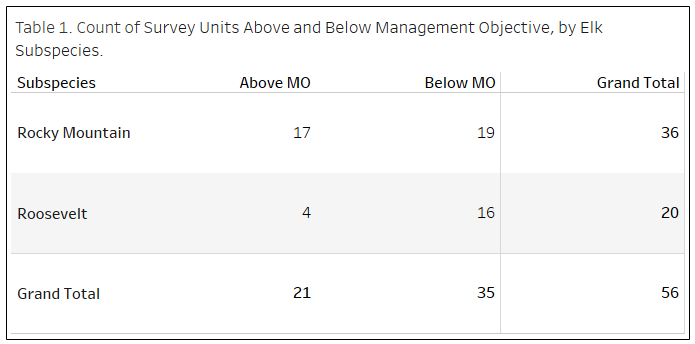
There are 56 elk survey units in Oregon with a MO, but only 21 (37%) of them have a PE higher than their MO (Figure 1).
Of the 20 Roosevelt elk survey units with a MO, only 4 units (20%) have a higher PE. Among the 36 Rocky Mountain elk survey units with a MO, 17 units (47%) have a higher PE (see Table 1).

The Mt. Emily survey unit has a PE furthest below its MO, with an estimated 2,700 fewer elk than MO. In contrast, the S. Fossil survey unit’s elk population is highest above, with 1,280 more elk than the MO (see Figure 2).

Herd Composition
Calf, cow and bull elk percentages of herd populations were calculated from ODFW’s published data. The calculations combined each survey unit’s overall population estimates with bulls:100 cow, or calves:100 cow ratios (see Table 2). The actual calculated calf, cow and bull elk herd compositions can be seen in Figure 3.
Table 2. Formulas to calculate bull, calf and cow elk populations. Calculation applied at the survey unit level.

Average Bull Population =

([Avg(Bulls:100 Cows)]/([Avg(Bulls:100 Cows)]+[Avg(Calves:100 Cows)]+100))*[Avg( Population Estimate)]

Average Calf Population =

([Avg(Calves:100 Cows)]/([Avg(Calves:100 Cows)]+[Avg(Bulls:100 Cows)]+100))*[Avg (Population Estimate)]

Average Cow Population =

(Avg(Population Estimate))-(Average Bull Population + Average Calf Population)

There was no significant difference in herd composition when comparing units above management objective to the units below (see Figure 4).

Hunter Harvest and Herd Compositions
Next, hunter harvests were compared to the total elk population. The elk harvest was also calculated as a percentage of the calf population. The harvest’s percentage of the calf population helps determine how many harvested elk are replaced by new elk each year.
For example, if there were 100 calves in a unit and the total antlerless and bull elk harvest was 50 elk, then the harvest as a percentage of calf population would be 50%. A high percentage would indicate less overall population growth, while a low percentage would indicate greater population growth.
The antlerless harvest as a percent of the cow population and the bull harvest as a percent of the bull population were also calculated to identify potential overharvest of breeding adults.
Harvest comparisons with the herd composition were only made for survey units that align with an individual hunting unit. This excludes survey units composed of multiple hunting units, or partial hunting units.
Calculations for the harvest percent of elk populations can be seen in Table 3.
Table 3. Formulas to calculate total elk, antlerless and bull, harvests as a percent of total elk, bull, cow and calf populations.

Elk Harvest % of Elk Population =

([Avg(Total Elk Harvest)]/[Avg(Total Elk Population)])*100

Antlerless Harvest % of Cows =

([Avg(Total Antlerless Harvest)]/[Avg(Total Cow Population)])*100

Bull Harvest % of Bulls =

([Avg(Total Bull Harvest)]/[Avg(Total Bull Population)])*100

Average Elk Harvest % of Calf Population =

([Avg(Total Elk Harvest)]/[Avg(Total Calf Population)])*100
Hunter harvest as a percentage of the total elk population and antlerless harvest percentage of the cow elk populations are lower in units below MO (see Figure 5A, 5B and supplementary correlation charts).
Higher total harvest percent of the elk population and a higher antlerless harvest as a percent of the total cow population did skew towards units with elk populations above their MO.

Using ODFW’s data, calculations from Table 3 resulted in bull harvest values greater than 100% of the estimated bull population (see Figure 6). Of the 15 units with bull harvest over 100% of the PE, 10 units were below MO.
However, when grouping units above or below MO, then comparing the bull harvest percentage of all bulls, units above MO have a median value of 93% of bulls harvested, while the median is 74% of bulls harvested in units below MO (see Figure 8). Median values were used instead of averages in order to avoid outlier value skewing.

Many units have a total elk harvest that is greater than 100% of their calf population (see Figure 7). However, unlike the bull harvest data, most units with a harvest total greater than 100% of the calf population are above MO.

Harvest as a percentage of calf, cow, and bull elk was higher in units above MO (see Figure 8).

Discussion
Oregon elk populations are below management objective in the majority of survey units. The cause is unclear, so this analysis attempted to identify if herd compositions or hunting harvest plays a role.
Herd populations did not show a substantial difference in calf, cow, or bull elk percentages of total elk in units above or below MO. The lack of sex-based differences is an important observation because low ratios of cow or bull elk can lead to lower reproduction rates.
Similar bull and cow percentages of herd populations, regardless of MO status, were supported by calf percentages, which were similar in units above and below MO.
When comparing harvest to populations, harvest in units below MO is a lower percent of calves, cows, or bull populations, than in units above MO. This could mean harvest is not the principle factor keeping populations below MO. It could also reflect ODFW management practices, where tags are reduced in units below MO.
ODFW’s poor data quality was an important observation in this analysis, and a major confounding factor. For example, comparing hunter harvests to population estimates can give results where more than 100% of the bull elk population is harvested each year. These results can be from data errors that originate in hunter harvests or population surveys.
Hunter harvest data appears less likely to be the cause of data errors. Year-to-year, the hunter harvest data is consistent within a unit, and most general units show an average hunter success rate of 5%-15%. This is in agreement with typical hunter success rates and lacks a substantial swing in success rate if over 100% of the bull population were harvested.
ODFW population estimates are the more likely source of data errors. In fact, while working on this analysis, these questionable population data points were noted:
- West Beulah Unit (2018) – Bull to 100 cows ratio was listed as 260 bulls:100 cows. For this VizWild analysis, the number was switched to 26 bulls: 100 cows. That was the only edit made to ODFW’s data.
- Maury Unit (2018) – 53 bulls: 100 cows.
- Dixon Unit (2018) – 100 calves: 100 cows.
- Willamette Unit (2018) – 101 calves: 100 cows.
Results showing a harvest greater than 100% of the bull population could be due to underestimates of the total elk population or bull: 100 cow ratios.
As noted in the bullet points above, ODFW’s calf estimates may also contain errors. While those bullet points highlight potential overestimates, underestimates might be more frequent in ODFW’s calf data. Which would explain results where hunter harvest is greater than the total calf population.
Those data issues call into question how ODFW is using the elk population and hunter harvest data, and the true status of populations compared to MO.
Despite limitations with the data, the analysis did show some good information about Oregon elk. Units below MO do not appear to have a disproportionate harvest of antlerless or bull elk compared to units above MO. However, it is unclear what percent of cows or bulls can be harvested while maintaining positive population growth. That percent may change from unit to unit.
To better understand why so many of Oregon’s elk herds are below MO, more data of better quality is needed. Population estimates need to be improved and better validated.
ODFW should also add data on calf recruitment rates, predator population estimates, and habitat comparisons. Those three variables have a significant impact on elk populations, but at present, the data is unavailable from ODFW. Should that data become available, a new analysis will be performed and posted to VizWild.
Supplementary Correlation Charts
Use the filter to swap see different correlation charts.

Supplementary Data Table
The below table contains all of the data used in this analysis. To download, click the box with the arrow pointing down.

Author’s Note
The primary goal of this work is to provide hunters with information about Oregon elk herds and their management outcomes. A secondary goal is to highlight hunters as the true stakeholders for Oregon big game populations and encourage other hunters to get active in the management process.
If hunters sit on the sidelines, then activists who oppose hunting or do not appreciate the value hunters bring to conservation will continue chipping away at your hunting rights until there is no hunting left.
Hunters should make sure to stay involved in the ODFW decision-making process. Contact your local state representatives and the ODFW commission about any wildlife-related regulatory changes. Join hunting advocacy groups like the Theodore Roosevelt Conservation Partnership (TRCP), Rocky Mountain Elk Foundation (RMEF), Oregon Hunters Association (OHA), or the Backcountry Hunters and Anglers (BHA). If you don’t, then anti-hunting activists will continue advocating against hunting while your voice remains silent.
Analysis was performed by Ian Martiszus. Ian does not work for ODFW but is a lifelong Oregon elk hunter.
Never forget, hunters are the first people and the last people to go to bat for wildlife.